Monitoring Tabs
This chapter describes the content of the individual tabs on the main screen. The following tabs are available:
System Info
The System info tab displays the following information about all monitored systems:
-
Monitored system: Displays basic information about the monitored system, e.g. the generated system ID, system description, type, or a defined list of supported monitoring areas.
-
SAP system information: Displays information about the installed SAP system version.
-
Host data: Displays information about the hardware configuration of the hosted machine.
-
Database data: Displays information about the central database system.
-
Connection data: Displays information about the connection to a monitored system:
-
RFC destination: Shows the RFC destination that is used when connecting to the remote SAP system. If the remote system is not an SAP system, this value might be empty.
-
Maximum time for PING: Defines the maximum timeout for the RFC ping in seconds.
NOTE You can change this value if you need a longer timeout period, for example if you have slow connection to the system that exceeds the default connection timeout period. To do so, start transaction /DVD/MON, click Settings > System settings and adjust the Timeout column. -
Check button: Allows you to check whether the connection for the added system is valid and working.
-
-
Server types: Displays information about defined server types for the system. You can modify the server type in the External server types view. To access this view, click the image icon
 next to the Server types field.
A list of servers is displayed at the bottom of the System info tab. This list provides an overview of servers, their names, the type of the server (application or database), the hostname, the number of CPU(s), the RAM size, the server location and a description. Servers that can serve as failover servers are also included in this list:
-
Application servers for SAP systems that are in a passive state, i.e. the Locality field is set to PASSIVE.
-
HANA nodes that are configured as standby nodes on the HANA database, i.e. the Locality field is set to STANDBY.
This special group of servers in the state PASSIVE or STANDBY is not monitored by default – they are treated as inactive servers. They exist for information purposes in order to see that such a special group of servers is available and configured on the monitored system. If these servers are switched to the state ACTIVE, the monitoring for these servers is automatically started.
If there is a flag in the Don't mon. column, the server is excluded from the monitoring.
If the number of CPU(s) and RAM size is equal to 0 for the specific server, it means that this server has no free resources. If this specific server has negative values set for CPU count or RAM size [kB] in the system settings, this server did not have any free aRFC resources for its monitoring.
Collector Jobs
The Collector jobs tab displays all collector jobs for the monitored systems and provides information regarding their statuses. From this tab, you can control and check the collector job runs.
For more information, see the chapter Scheduling the Monitoring of KPIs.
In the list of collector jobs, the following information is displayed:
-
SID: Shows the system ID for which a collector job has been created.
-
Profile: Shows the monitoring profile of a KPI assigned to the collector job. For more information, see the chapter Defining Monitoring Profiles for KPIs.
-
Status icon and Job status: Shows the status of a collector job. Collector jobs can have the following statuses:
 – Not running: The collector job is not scheduled.
 – Scheduled: The collector job is scheduled for periodical runs in the future.
 – Waiting: The collector job is waiting for free work processes.
 – Running: The collector job is currently running.
-
Period value: Defines the value for how often a collector job runs.
-
Period type: Defines the unit for how often a collector job runs.
-
Collector job run:
-
Stop: Stops and cancels the scheduled collector job if the collector job is running.
-
Start: Starts the collector job if the collector job is not running.
NOTE If any collector job is in a suspended state (e.g. suspended by an SAP standard function before any system activities), it is not possible to start or stop the job and the following message is raised:
It is not allowed to start/stop/pause suspended jobs for system '&1' and profile '&2'.
In this scenario, your SAP Basis team must change the suspended job into an unsuspended state before starting the collector job again.
-
-
Execution: Defines the execution of a collector job. This value can be immediate or scheduled on a specific date and at a specific time.
-
Start date: Displays the date of the initial run of a collector job.
-
Start time: Displays the time of the initial run of a collector job.
-
Retention time(days): Shows how long old collected data is stored by the collector job. Data older than retention time is automatically deleted with the exception of data, which is excluded from deletion.
-
Background job name: Displays a button containing the name of the background job of the collector job. Clicking this button starts transaction SE37, which displays this job.
-
Last status icon and Job last status: Together display the status of the last job run. The following statuses are possible:
-
 Finished: The last background job of a collector job finished successfully.
 -
 Aborted: The last background job of a collector job was terminated due to an error or was canceled by the user.
 -
 Not running: The collector job has not been started.
-
-
Delay [s]: Any delay of current background job in seconds while waiting for a free work process.
-
Run date: Shows the date of the current background job execution.
-
Run time: Shows the time of the current background job execution.
-
Duration [s]: Shows how long has the current background job been running.
The following fields are available below the table:
-
Create date: Date of the background job creation of a collector job.
-
Create time: Time of the background job creation of a collector job.
-
Creator name: User who started or stopped the background job of a collector job.
-
Last run date: Date when the last background job was started.
-
Last run time: Time when the last background job was started.
-
Last delay: Delay of the last background job in seconds while it was waiting for a free work process.
-
Last duration: How long the last background job of a collector job was running.
-
Next run date: Date of the next collector job run.
-
Next run time: Time of the next collector job run.
-
Remaining time: Time in seconds after which the next run of a collector job will occur.
If you double-click the collector job record in the list, all the relevant information is displayed in detail in the lower area.
In addition to collector job-specific options, the top menu bar contains all the standard buttons for working with the ALV list, for example sorting, filtering, etc.
In addition, a Refresh button is available along with information about the last time the screen was refreshed.
KPI Charts
The KPI charts tab displays all the collected KPIs of monitored systems in the form of charts.
In these charts, you can view the behavior of monitored KPIs with respect to the time and systems you have specified. Each chart describes one measured KPI in a selected time interval for systems and servers that you have selected under System landscape.
A KPI context menu is also available. For more information, see the chapter KPI Tree and Context Menu.
For more information about displaying KPIs, see the chapter Displaying KPIs.
KPI Mix
The KPI mix tab allows you to display several KPI series in one chart and compare dependencies between all measured and displayed KPIs in this chart. For more information about the KPI mix chart, see the chapter Displaying Several KPIs in the KPI Mix Chart.
Messages
The Messages tab displays the status of messages identified by CrystalBridge® Monitoring, for example during the collection of KPIs for the monitored system. Each message contains a text description with some additional information such as when the message occurred, on which system/server, and type the message.
There are three standard types of messages:
 – OK or success messages
 – Information or alert messages
– Error messages
The displayed messages are dependent on the selected systems or servers under System landscape. This tab also contains standard ALV operations such as sorting, filtering, aggregating, etc.
You can display messages in an aggregated view or in a non-aggregated view by selecting the Use aggregated view option located above the ALV output.
Aggregated View
By default, messages are displayed in the aggregated view. The benefit of this aggregated view is that message texts that are identical are only displayed once in ALV output along with the total number of occurrences per each message in the Count column. This total number of occurrences represents all occurrences of the specific message for the whole time – not only for a defined time period for displaying data. The Date and Time columns display the last date and time when this message was reported.
In the aggregated view, you can double-click the row for a specific message to display additional details in a pop-up, for example the time when this message first occurred or the number of all occurrences for this message.
Non-aggregated View
If you use the non-aggregated view to display messages, each message occurrence is displayed as a separate row in the ALV output. We recommend using this view if you want to display the occurred messages in a defined time period, for example the last two hours. It provides an overview of all occurrences of the same message at different times – not only the last time when this message was reported.
To use the non-aggregated view, you must disable the relevant configuration parameter (empty value). If this configuration parameter is enabled with the value X, it does not save each message occurrence to the database table, and no data can be loaded and displayed.
If you double-click the row for a specific message in the non-aggregated view, only the technical name of the collector along with the occurred message is displayed.
At the top of the Messages tab, the Message group drop-down menu allows you to filter the displayed messages. This drop-down menu contains all the available message groups. You can view the technical details of the message in its long description by selecting the relevant row and double-clicking the question mark icon. For more information about specifying the relevant message ID and number, see the chapter Message Groups.
Technical Message Groups
There are two message groups that are not available in the customizing and are not modifiable.
-
DEFAULT: This default message group is selected when the application is started. This view displays all messages except for the excluded ones. You can specify a list of messages to be excluded in the message group EXCLUDED.
-
All messages (with excluded): This group displays all messages, including the excluded ones.
Additional details about the displayed message
Some collectors already provide additional texts of the raised messages via the pop-up window when the user double-click the specific message.
For example, for SQL-based KPIs that are collected by the SQL collector, addtional details are displayed in this pop-up if any failures occurred during the SQL execution. For example, the SQL code error, a description of the error, and the full string of the executed SQL statement.
Details
The Details tab contains additional KPI information collected from the monitored systems and stored in a detail table. It displays a list of collected detail tables by default. You can display all the available detail tables along with the non-collected ones by adjusting the setting hide non-collected detail tables.
You can search and filter this list by technical name or by displayed description for a detail table. Next to the list of detail tables, collected details for a KPI are displayed. Using these details, you can perform all standard ALV operations such as sorting, filtering, aggregating, etc.
You can also view additional technical information about a detail table by clicking the  icon. For more information, see the chapter KPI Details Displayed in a Detail Table.
Alerts
The Alerts tab displays messages during the monitoring and collection of KPIs. An event occurs when one or more specific KPI values exceed the defined KPI threshold. Listed below are some examples of events when an alert occurs:
-
Multiple short dumps within a short period of time
-
System downtime or unavailability
-
System stops or restarts
-
Atypical peaks or troughs in system performance
-
Start or end of SLO operations (conversions or migrations)
-
Users working in the system during conversions
Such events occur if the corresponding KPI values are outside of the threshold limit. If these events last for a long time, the alerts keep informing you that such events are still occurring. This enables you to keep track f and monitor the progress of the events. For more information, see the chapter Defining Alerts.
When an event occurs, the process is recorded and stored within the Alerts tab. This tab contains an ALV list of events that have occurred. Each row of the list represents one event and includes information about the system as well as the server if the KPI of the event is server-specific.
The following alert statuses are available:
-
 – Success
 -
 – Warning
 -
 – Issue
 -
 – Error
The Count column displays the number of event alerts that have occurred. Additional information is also displayed here, for example when an event started and when it ended (if it has ended), the event description, etc.
You can use the ALV list of messages to perform all standard ALV operations such as sorting, filtering, aggregating, etc. For a more detailed view of an event, double-click a row.
Example of the detailed output:

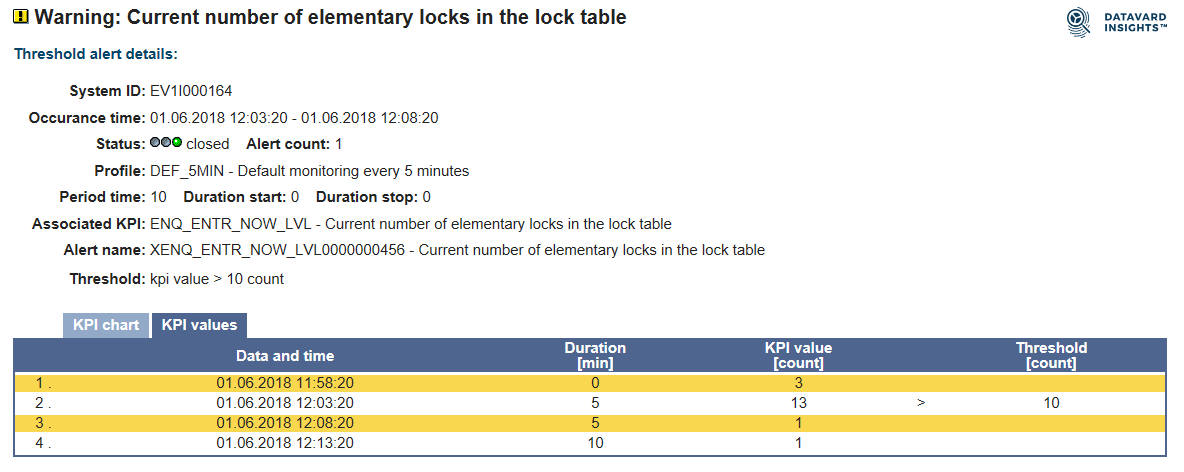
Detailed output