Extended Query Statistics
Cleaning up Extended Query Statistics
You can use the report /DVD/QS_DELETE or transaction /DVD/QS_DEL to clean up the extended query statistics that are collected in tables /DVD/QS_INFO and /DVD/QS_QVAR.
Scheduling the Cleanup
If you want to clean up statistics regularly, you must create a dynamic variant for the report /DVD/QS_DELETE. Proceed as follows create a dynamic variant:
-
Start transaction SE38 and execute the report /DVD/QS_DELETE. Alternatively, you can start transaction /DVD/QS_DEL.
-
Click Variants.
-
Chose new variant name and click Create.
-
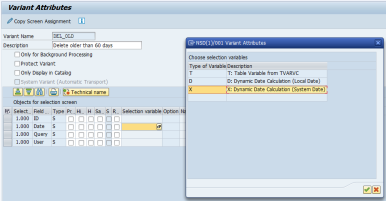
Click Attributes.
-
In the Selection variable column, select the Date field and press F4.
-
Choose which date to use for the dynamic calculation: System Date or Local Date.
-
Click Confirm.
-
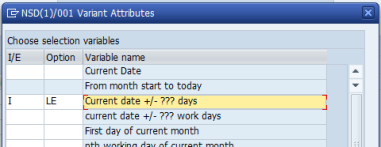
In the Name of variable column, select the Date field and press F4.
-
Choose which select option to use for the execution. In this example, we have selected everything less than or equal to the current date, minus X days.
-
Click Confirm.
-
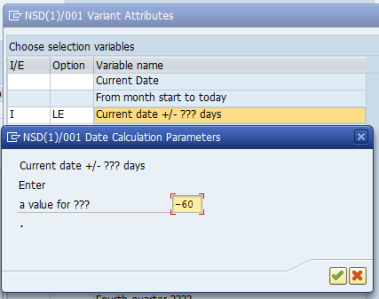
In the field Enter a value for ???, choose how many days to subtract from the current date.
-
Click Confirm.
-
Click Save.
-
The dynamic variant has been created. You can now use the created variant and schedule a job that will run on a regular basis.
Query Element Usage Statistic and Analysis
Report for Query Element Usage / InfoObject Usage
The extended query statistics include information about which query elements were used during the query execution. Query definitions can include elements such as free characteristics and key figures that you can use to drill down further and obtain more detailed information about the aggregated data. However, most of them are hidden by default, and not all of them are used regularly. Using these statistics, you can identify the elements that are used the most, used the least or never used.
Query elements can use one or more InfoObjects. Therefore, based on the usage report on the query elements, you can also obtain the InfoObject usage. The report enables you to analyze statistics from different perspectives. You can group, show or hide the desired result fields to achieve the most suitable granularity for your statistical data.
Technical Information
| Report | /DVD/HS_QUERY_ELM_USAGE |
|
Transaction |
/DVD/HS_ELMUSG |
Report Parameters
The report enables you to analyze usage statistics with different view perspectives and with selected filters and aggregation. You can customize your view preferences in the Query elements usage report window. Note that the initial load of the report contains no data. After you click Execute, the desired data is loaded.
In the From – to fields at the top of the screen, you can specify dates and times to filter the selection.
The following additional options are available:
|
Area |
Field |
|---|---|
|
Aggregation |
Statistics can be aggregated to two source data types:
|
|
The Detail level drop-down menu contains the following options:
|
|
|
Columns |
Options for display or hiding the columns in the results below. |
|
Subtotals |
Columns that are used for the subtotals. |
|
Filters on the right-hand side |
Result filters that are applied to the table below, for example Query, Username, Key, etc. |
Result Table
The result table contains statistics based on the selected filters and aggregation.
|
Column |
Description |
|---|---|
|
Query |
Technical name of the query |
|
Query description |
Description of the query |
|
Description |
Description based on the selected aggregation:
|
|
Key |
Technical name of the query element. You can find the technical name in the BEx Query Designer. To do so, in the menu bar, click View > Technical Names > [Key] Text. |
|
Enterprise ID |
Unique ID of the query element You can find the enterprise ID in the BEx Query Designer. To do so, in the toolbar, click Query Properties and go to the Extended tab. |
|
InfoObject |
Technical name of the InfoObject |
|
Username |
Technical name of the user who used the query element. Note that the collection of the username must be enabled in the extended query statistics. |
|
Type |
Type of the query element |
|
Subtype |
Subtype of the query element |
|
Structure |
Technical name of the element's parent structure |
|
Structure enterprise ID |
Enterprise ID of the element's parent structure |
|
Date |
Date when the query element was last used |
|
Usage |
The number of times the query element was used in the query execution |
List of supported query element types and subtypes:
|
Type |
Subtype |
Description |
|---|---|---|
|
SEL |
STM |
Structure element |
|
SEL |
CHA |
Free characteristic |
|
FML |
STM |
Formula |
|
CKF |
CKF |
Calculated key figure |
|
SEL |
RKF |
Restricted key figure |
Collecting Statistics
To analyze the used query elements (free characteristics and key figures) in the future, you must enable their analysis as shown below. Proceed as follows to enable the collection of statistics:
-
Start transaction SE38 and execute the report /DVD/QS_CONFIG. Alternatively, you can start transaction /DVD/QS_CONF.
-
The Query statistics settings window opens.
-
Set the Displayed query elements radio button to ON.
-
Click Save.
Query Statistics Automatic InfoObject Exclusion
The CrystalBridge® Monitoring query statistics function contains a safety feature to minimize the impact on reporting performance in the customer system. If the processing of query filters during the query execution exceeds the defined time, the following threshold function is triggered:
-
Query filters are processed and the InfoObject with the most occurrences (e.g. 0MATERIAL with 10,000 I EQ XXX filters) is automatically added to the list of excluded InfoObjects.
-
Every other execution of CrystalBridge® Monitoring query statistics collection will omit filters on such InfoObjects globally. This decreases the processing time, the impact on reporting performance and the space needed (excluded filter values are not saved in the database).
-
Standard time characteristics are never excluded: 0CALYEAR, 0CALMONTH, 0CALWEEK, 0CALDAY, 0FISCYEAR, 0FISCPER.
Proceed as follows to view every automatically excluded InfoObject:
-
Start transaction SE38 and execute the report /DVD/QS_CONFIG. Alternatively, you can start transaction /DVD/QS_CONF.
-
The Query statistics settings window opens.
-
Click Exclude characteristics.
-
A list of all automatically excluded InfoObjects is shown in a table. The Processing Time Reached column shows the processing time in seconds that the query reached when this exclusion occurred.
-
Automatically excluded InfoObjects are shown in the multiple selection option together with other user-defined exclusion selections.
-
You can change the processing time limit that triggers the exclusion by changing the value in the Processing time limit field from the default value 1 (in seconds).