Fiori Dashboard Customization
System Health Tiles and Analysis Setup
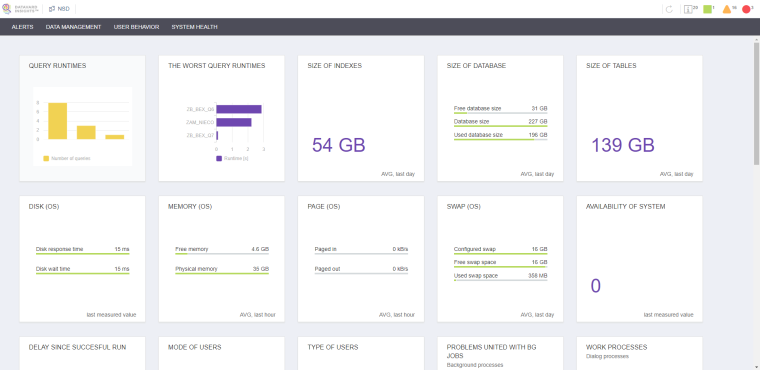
The System Health category mostly contains generated charts that display KPI values for the selected system. To navigate to this window, select the system in the main view and click System Health.
You can define the setup of these tiles for every system in the SAP tables /DVD/MON_ODT_KTA, /DVD/MON_ODT_ANT and /DVD/MON_ODT_AN. The settings below are advanced and should only be changed after consulting with SNP Support or your SNP consultant.
The KPIs displayed in the system health tiles are defined in the table /DVD/MON_ODT_KTA.
![]()
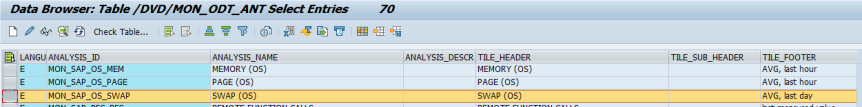
The tile header, subheader and footer are defined in the table /DVD/MON_ODT_ANT.
The type, size, aggregation period and aggregation function of data for the tile are defined in the table /DVD/MON_ODT_AN.
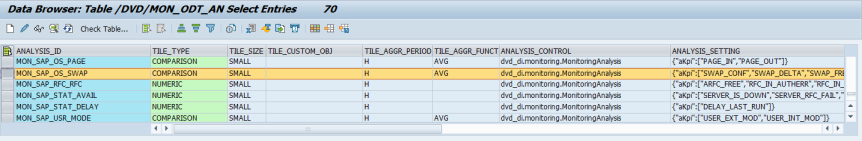
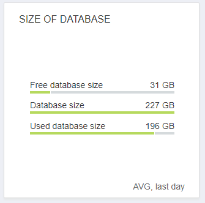
Example: The above record defines the following tile:
After clicking a tile, you are directed to the monitoring view, which displays KPIs. The top left-hand corner contains the name of the selected analysis (SWAP OS in this example).
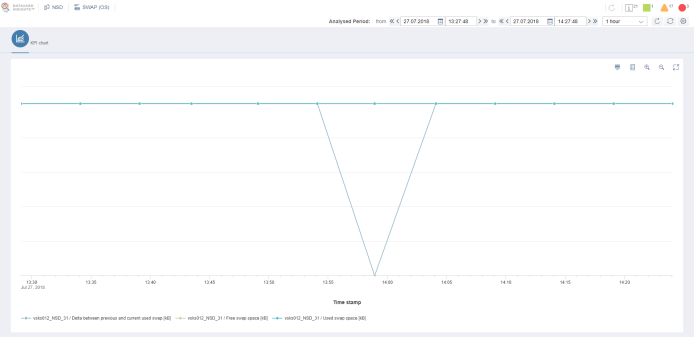
You can define the analysis name in the table /DVD/MON_ODT_AN under the column ANALYSIS_NAME. For more information, please contact SNP Support or your SNP consultant.
For more information about the monitoring view, see the chapter System Monitoring.