BW User Behavior
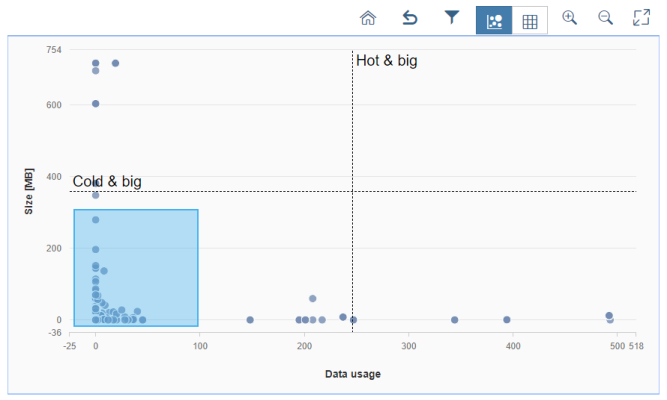
Data Size vs. Query Usage
This visualization shows the relationship between data access and the size of InfoProviders divided by time characteristic in form of a scatter plot. The example below uses the time characteristic Year. The chart shows you how many times the data of the corresponding year of an InfoProvider was accessed in reporting. It summarizes the displayed information in tiles on the right-hand side.
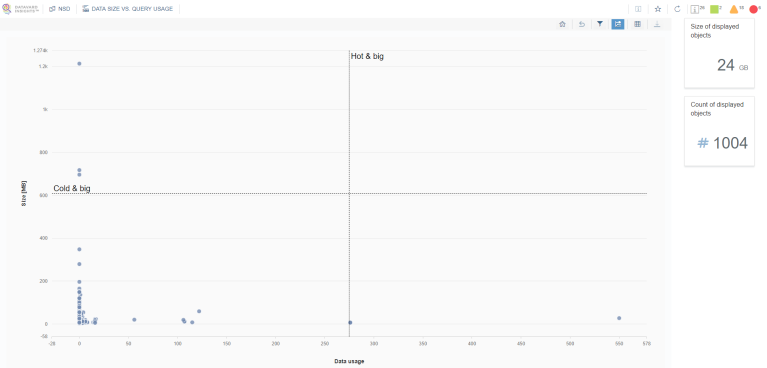
It is possible to select multiple objects and display only these objects in the chart.
You can display all collected objects by clicking  .
.
You can return to the previous selection by clicking  .
.
You can filter all the data by clicking  .
.
The table view is also available in individual form, with each object listed separately. Objects on the chart are listed in a table and can be downloaded to a CSV file for further processing.
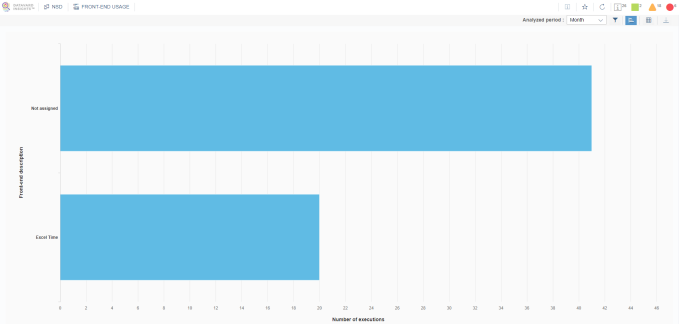
Front-end Usage
This visualization shows the usage of different front ends. It shows you which front ends are used and how many queries were executed via them during the analyzed time period.
You can filter the data and switch to the table view for more detailed information as well as to download the data in CSV format for further processing.
You can click the data in the chart area to access the other analysis – Query usage by country. A filter based on the selected data is applied.
The handle type is used to distinguish between the different front ends, i.e. the field HANDLETP in the table RSDDSTAT_OLAP. The following table shows the possible front ends that can be collected:
|
Handle type |
Front end description |
|---|---|
|
CMD |
BEx web application |
|
EXTN |
External application, e.g. SAP BusinessObjects, SAP Crystal Reports, etc. This handle type collects data from all external applications. |
|
XLS |
Excel (BEx Analyzer) |
|
MDX |
OLAP BAPI (MDX, XML for Analysis, OLE DB for OLAP) |
|
BICS |
ABAP BICS API |
|
W3_I, W3_T |
Web templates |
|
BTCH |
Batch query |
|
PLAN |
Planning |
|
PLPE |
Planning via the Planning Engine |
You can also define your own custom logic for separating front ends based on the handle type by implementing the BADI /DVD/HS_GET_QUERY_FRONTEND_USG.
Query Usage by Country
This visualization shows the usage of different queries from all over the world. It shows you the countries from which queries were executed as well as how many times within the analyzed period.
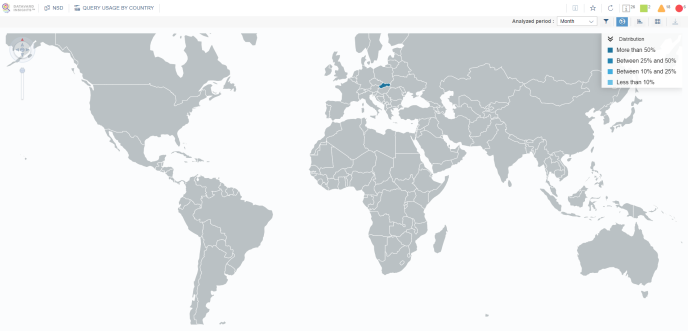
You can filter the data and switch to the table view for more detailed information as well as to download the data in CSV format for further processing.
You can click a country in the map or in the bar chart to access the other analysis – Query usage by user group. A filter based on the selected data is applied.
The country is identified via the company address assigned to the user that executed the query.
You can also define your own custom logic for assigning a user to a country by implementing the BADI /DVD/HS_CENTRAL_GET_QUERY_GRP.
Query Usage by User Group
This visualization shows the usage of different queries according to user groups within the analyzed period.
You can filter the data and switch to the table view for more detailed information as well as to download the data in CSV format for further processing.
You can click the user group in the bar chart to access the other analysis – Query usage by query group. A filter based on the selected data is applied.
The User group for authorization check is used as the default implementation for identifying a user group. You can also define your own custom logic for assignation a user to a user group by implementing the BADI /DVD/HS_CENTRAL_GET_QUERY_GRP.
Query Usage by Query Group
This visualization shows the usage of different queries according to query groups within the analyzed period.
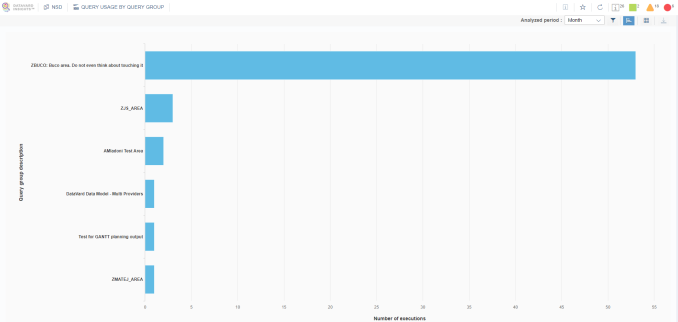
You can filter the data and switch to the table view for more detailed information as well as to download the data in CSV format for further processing.
You can click the user group in the bar chart to access the other analysis – Query top usage. A filter based on the selected data is applied.
The query group is read from an InfoArea that contains the InfoProvider where queries were executed. You can also define your own custom logic for identifying a query group by implementing the BADI /DVD/HS_CENTRAL_GET_QUERY_GRP.
Query Top Usage
This visualization shows the most-used queries within the analyzed period.
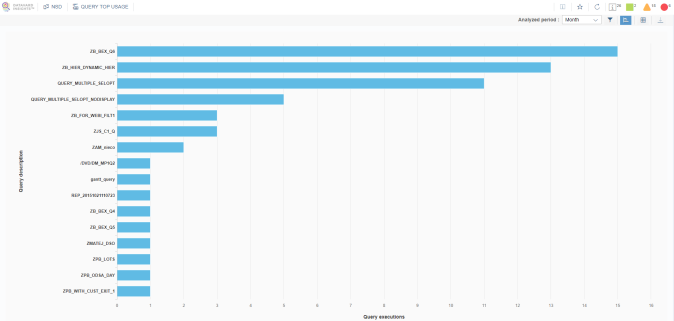
You can filter the data and switch to the table view for more detailed information as well as to download the data in CSV format for further processing.
You can click the query in the bar chart to access the other analysis – Query runtime single. A filter based on the selected data is applied.
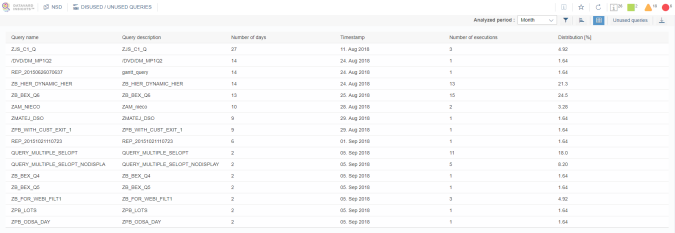
Disused and Unused Queries
This visualization shows disused and unused queries per analyzed period. Disused queries are queries that are no longer used, while unused queries are queries that have never been used at all.
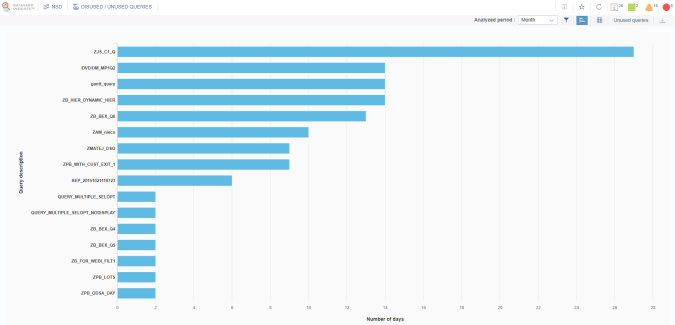
You can filter the data and switch to the table view for more detailed information as well as to download the data in CSV format for further processing.
You can switch between disused and unused analyses. Unused queries are displayed as a list.
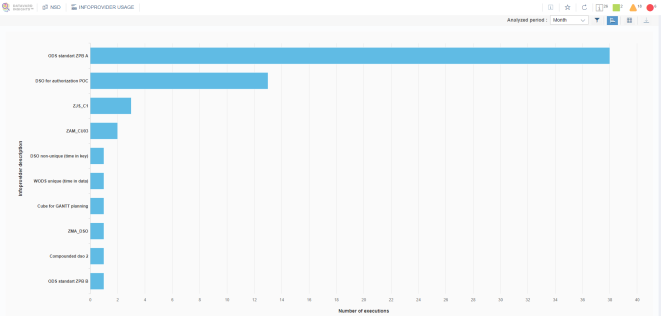
InfoProvider Usage
This visualization shows the reporting usage (query executions) of InfoProviders in the analyzed time period.
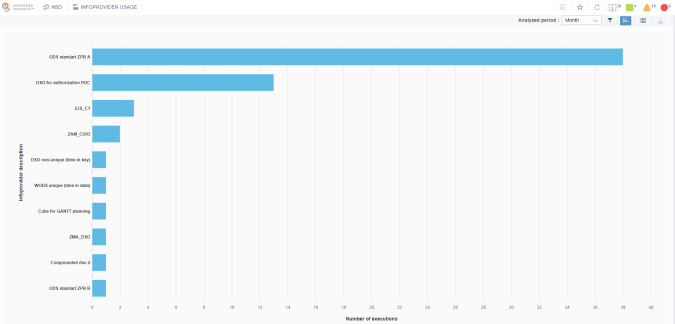
You can filter the data and switch to the table view for more detailed information as well as to download the data in CSV format for further processing.