BW Data Management
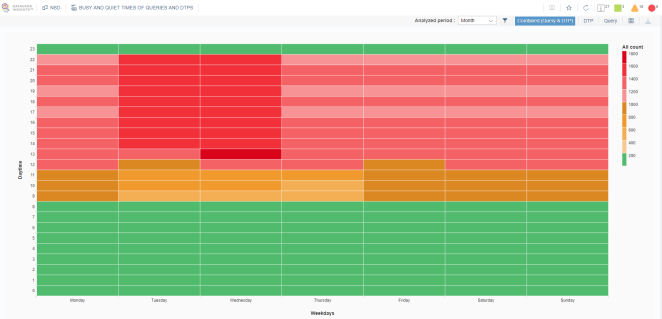
Busy and Quiet Times of Queries and DTPs
This analysis provides an overview of busy and quiet times of queries and DTP loads that have been executed on all InfoProviders on a monitored system.
The heatmap shows the total number of queries, DTPs or queries and DTPs. You can change the view by clicking Combined (Query & DTP), DTP or Query. Data is aggregated by weekdays and hours, and you can filter it by a specific InfoProvider or by analyzed period.
This analysis can help you to identify quiet hours, e.g., for operations that need a lot of system resources. You can also examine the busiest hours and move their content to other less busy hours.
InfoProviders by Size
This analysis provides an overview of all InfoProviders on the system divided into three size categories: 10%, 30% and 60%. Each category represents the size of InfoProviders that correspond to a particular group. For example, the 10% group represents the 10% largest InfoProviders and their corresponding size. You can click a bar to redirect the application to the Top InfoProviders analysis, and the Top % filter will be applied accordingly.
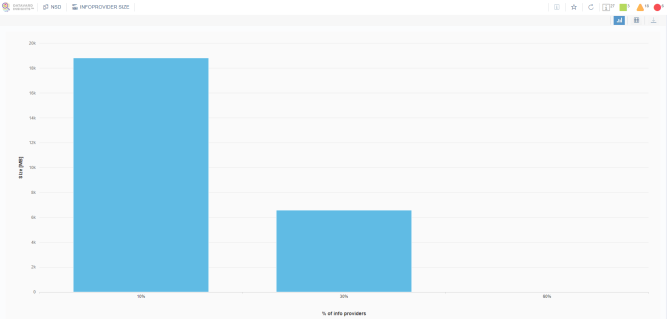
You can switch to the table view for more detailed information about downloading data to a CSV file for further processing.
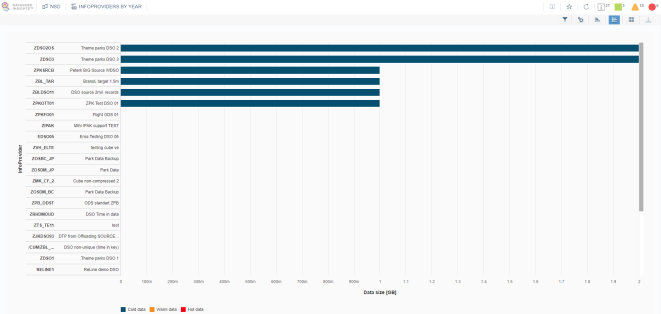
InfoProviders by Year
This analysis provides an overview of InfoProviders by year on the system. Two charts are displayed here:
-
Distribution by InfoProvider type: Displays the entire system per InfoProvider type.
-
InfoProviders: Displays objects in the chart. They are sorted by their size by default and can be further filtered.
Both charts always display the last four years. Other years are merged into other groups, for example 2013 and lower, based on the amount of InfoProvider data that belongs to the group.
.
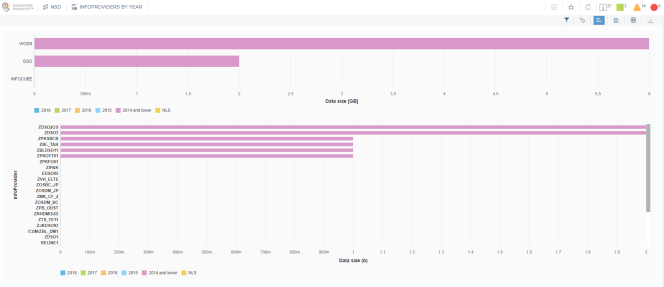
You can filter the data and switch to the table view for more detailed information as well as to download the data in CSV format for further processing.
It is possible to switch the color mode of the bottom chart to Query usage. This color mode groups data in InfoProviders by its reporting usage:
-
Blue: All data that was reported on less than 10 times.
-
Orange: All data in between these two defined threshold values.
-
Red: All data reported on more than 1,000 times.
You can change these threshold values by clicking  .
.
NLS Potential
Based on the analysis performed on the system, this visualization provides you with an overview of the potential for archiving particular object types in form of column charts, for example InfoCubes, DataStore Objects and Write-Optimized DSOs.
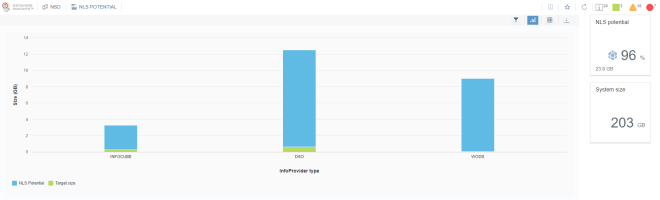
You can change the archiving settings by clicking ![]() . The analysis then recalculates the archiving potential accordingly.
. The analysis then recalculates the archiving potential accordingly.
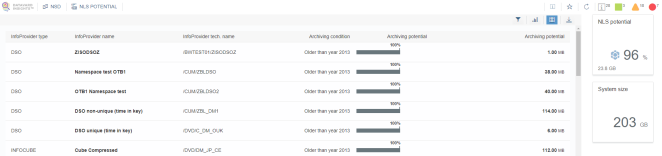
The table view provides you with detailed archiving potential at the object level. You can download data to a CSV file for further processing.
Data Distribution Analyses
These analyses provide information about how data is distributed in InfoProviders based on a specified characteristic and based on how many times these data areas were accessed by reporting (queries). The number of data distribution analysis tiles depends on the settings defined on the central system. By default, the BW Analysis is delivered with only one predefined data distribution analysis. The data distribution analysis tile displays the number of analyzed InfoProviders that contain the specified characteristic. The figure below displays the temperature-based data categorization, which is a type of data distribution and is included in the package by default.
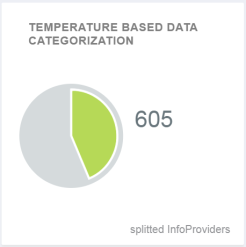
You can click a tile to view detailed results of the specified data distribution analysis.
The result table contains multiple columns. The following columns are present in all data distribution analysis results:
|
Column |
Description |
|---|---|
|
Object |
Technical name of an InfoProvider |
|
Type |
Type of an InfoProvider. Possible types: InfoCube, DSO, ADSO, WODS |
|
Description |
Long description of an InfoProvider |
|
Size [MB] |
Total object size in MB:
The table size calculation differs depending on the database type:
|
|
Rows |
Number of rows in InfoProvider data tables. The same tables are used as in the size calculation. |
|
Number of queries |
Total number of queries that read data in an InfoProvider. This column can contain a value above 0 even the InfoProvider is empty. This situation occurs when a query uses a MultiProvider that includes this InfoProvider. |
|
Trend – Number of queries |
Visualization displaying the usage of data areas. Values are rounded to natural numbers. |
|
Trend – Size [MB] |
Visualization displaying the size of data areas. Values are rounded to natural numbers. |
|
Split characteristic |
Applied time split characteristic. If the characteristic is empty, the data distribution analysis does not identify a suitable characteristic, and the distribution of the columns Size [MB] and Number of queries is not successful. |
|
Archived size [MB] |
Size of unpacked archived data in MB. This is the size of data in an online database that would be occupied if all archived data were reloaded. |
|
DTP source count |
How many times an InfoProvider is used as a source in DTP load requests. |
|
Last DTP exec. |
Timestamp of the last DTP load request execution. |
|
DTP dest. count |
Number of DTP requests loaded into an InfoProvider – including reloaded requests from an archive. |
|
DTP dest. relv |
Number of requests (DTPs for InfoCubes, activation requests for DSOs) that are relevant for the straggler analysis:
|
|
DTP stragglers |
Number of requests with straggler records. This is a subset of requests relevant for the straggler analysis, which contain at least one straggler record. For more information, see the chapter Straggler Analysis. |
|
DTP stragg. rows |
Number of rows that represent straggler records. |
|
Number of lookups |
Number of lookups that are present in the system for an InfoProvider. This refers to the number of lookups in the source code. |
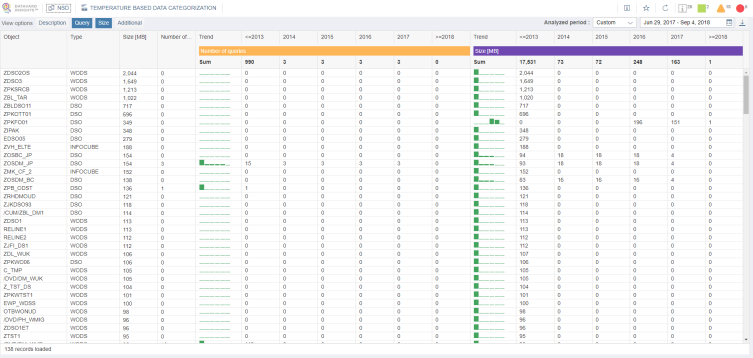
The columns Size [MB] and Number of queries depend on the data distribution settings of a particular analysis. These columns are created based on the data groups that you specify in your analysis. For more information about defining the data distribution and its respective data groups for the analysis, See the chapter Defining the Data Distribution Analysis.
These two columns contain a sum (for sizes) and sum (for the use) of the corresponding data area values. The footer of the table displays the number of records that were already loaded into the table. This number gradually increases as you scroll down in the table.
You can filter the content of a table column by clicking the column header.
You can download the table content (without chart columns) into a CSV file by clicking  in the toolbar.
You can show or hide specific column groups by clicking the column groups in the View options menu bar.
You can sort and filter the results in a particular column by clicking the column header and selecting Sort Ascending or Sort Descending or applying a filter.
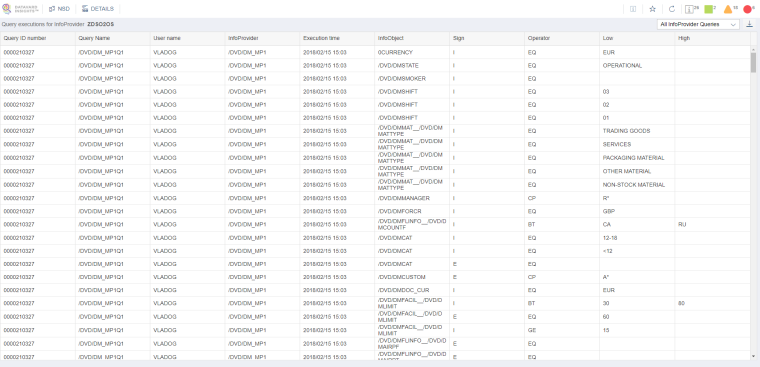
You can click any InfoProvider line to display queries that were executed on the InfoProvider. Each line in this detail view contains a query that was executed with a filter selection which was used during its execution. Only filters for the same characteristic that was used for the data distribution are displayed.