Adding a Custom Tile
To add custom tiles, click Add custom tiles in the top right-hand corner of the screen.
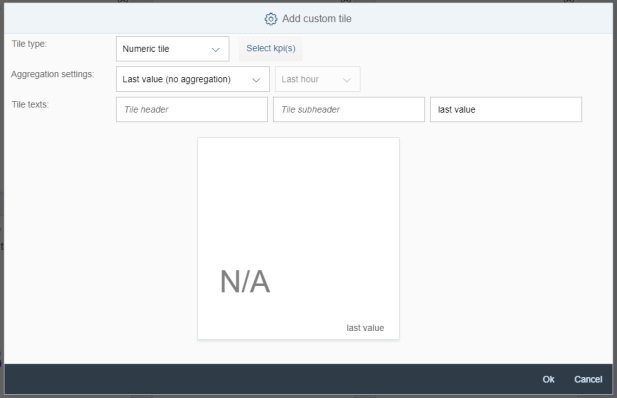
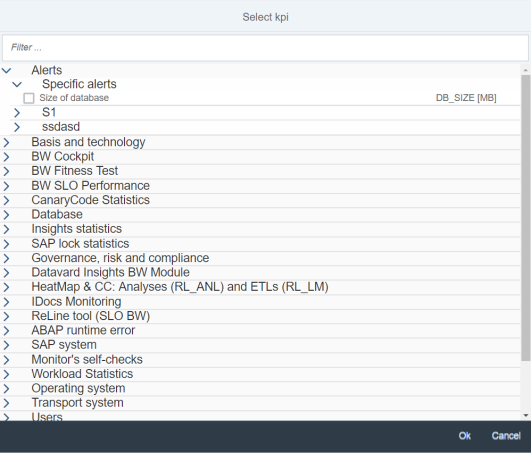
You can click Select KPIs to choose a KPI for the custom tile. You can only select multiple KPIs if the tile is a comparison tile (see the figure below).
The following options are available:
-
Tile type: The following tile types are available:
-
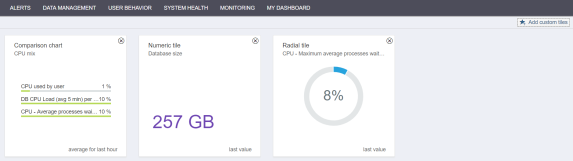
Comparison chart: Allows you to select one or more KPIs and compare their values side by side.
-
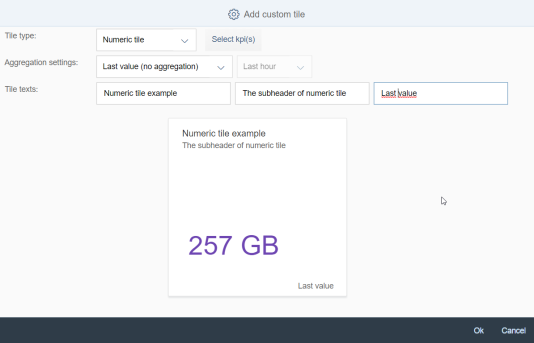
Numeric tile: Displays one number for one KPI.
-
Radial tile: Displays the value of one KPI in a radial graph.
-
-
Aggregation settings: Displays an aggregated KPI value collected for a specified time. You can select one aggregation function and choose the time period for the aggregation. The following aggregation functions are available:
-
Last value (no aggregation): Displays the last selected KPI value.
-
Minimum: Displays the minimum KPI value in the selected time period.
-
Maximum: Displays the maximum KPI value in the selected time period.
-
Average: Displays the average KPI value in the selected time period.
-
Count: Specifies how many times a KPI value was collected.
Example: Maximum KPI value in the last hour.
-
-
Tile texts: Allows you to enter tile text to describe the selected KPI. The custom tile text is displayed as follows:
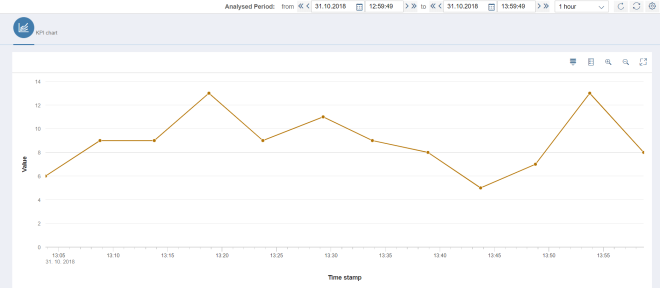
You can click a tile to display all the available information about that particular tile. You are then navigated to the KPI chart screen, with provides more filters and selection options.