Controlling Areas
The Controlling Areas chapter focuses on customized controlling areas, their usage and conflicting organizations across systems. Chapters 7 to 11 are all related to organization analysis and are designed in the same way. Refer to this chapter for an explanation of the pages.
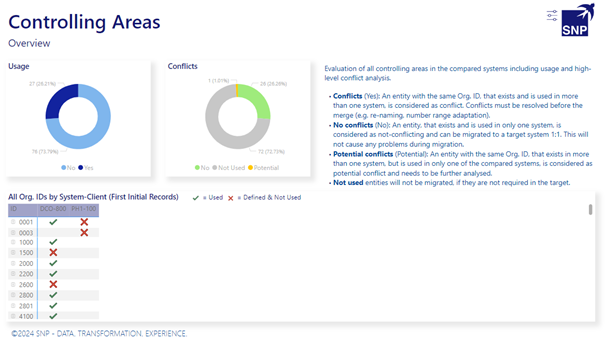
The chapter starts with an overview of existing controlling areas in the compared systems, their usage and conflicts. The different classifications for conflicts are as follows:
-
Conflicts (Yes): An entity with the same org. ID that exists and is used in more than one system is considered a conflict. Conflicts must be resolved before the merge (e.g. renaming, number range adaptation).
-
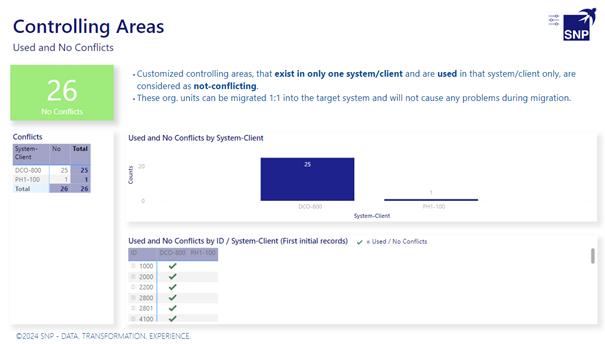
No conflicts (No): An entity that exists and is used in only one system is not considered to be a conflict and can be migrated to a target system 1:1. This will not cause any problems during the migration.
-
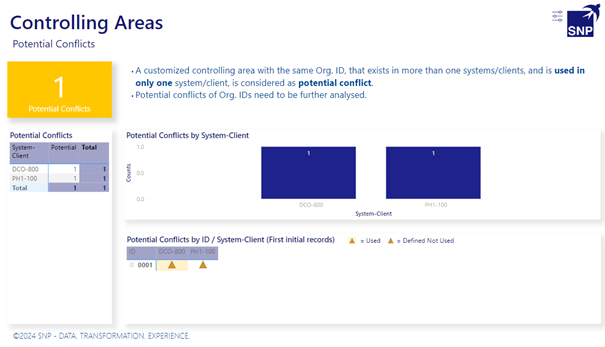
Potential conflicts (Potential): An entity with the same Org. ID that exists in more than one system but is used in only one of the compared systems, is a potential conflict. Such entities need to be further analyzed.
-
Unused entities: Unused entities will not be migrated if they are not required in the target system.
The table below the charts shows all the maintained controlling areas in the systems and marks them as either used (green tick) or unused (red cross).
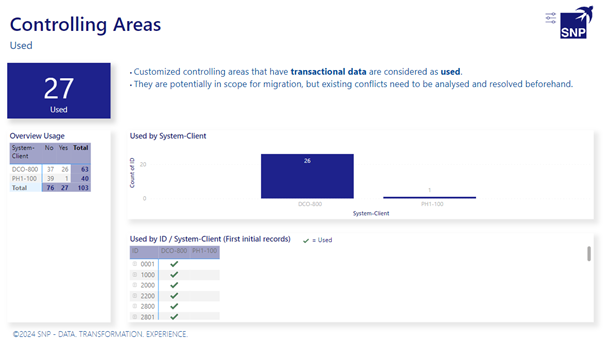
The Used page focuses on the used controlling areas within the system. The used controlling areas are potentially in scope for migration, but they need to be checked for potential conflicts. You can do so using the conflict analysis on the following pages.
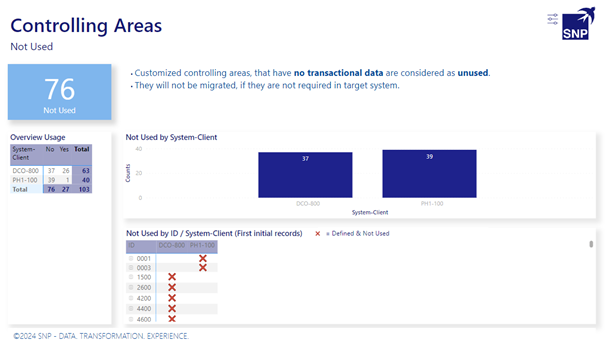
Before you get to the conflict analysis, the Not Used page provides a summary of all unused controlling areas cross systems. These controlling areas are potential candidates to be left behind in a migration.
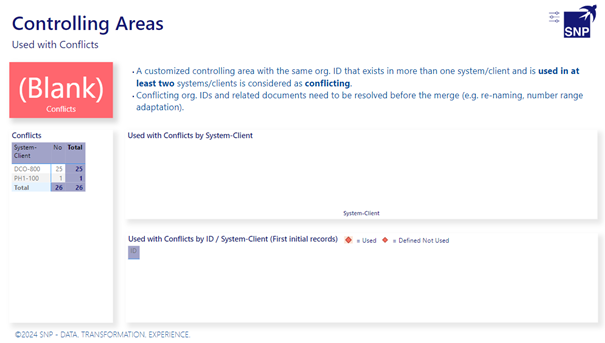
The Used with Conflicts page provides an insight into the number of controlling areas that exist in multiple systems and are used. These conflicts need to be resolved before the migration.
The Potential Conflicts page shows org. units that are configured in more than one system but are only used in one system. You need to manually check these org. units to verify whether any configuration is required or if the unused ones can just be left behind.
The Used and No Conflicts page shows the non-conflicting controlling areas, which means all the controlling areas that are in use but only exist in one system. You can migrate non-conflicting and used organizations 1:1 to a target system.
Merging multiple systems into one or several target system(s) is a challenging task and needs to be planned carefully. The Target (Based on Org. Usage) page provides an overview of used, unused and conflicting organizations of the analyzed systems and the number of org. units that would be migrated to a target system. It also shows the number of conflicts that need to be resolved before the merge.
While setting up the Extended Reporting for Merge, you can define the number of target systems as well as which source system is planned to be migrated into which target system. A many-to-many assignment of analyzed systems to target systems is possible. After rendering the report, this page will consider the number of determined target systems and the distribution of analyzed systems into the target systems, including an org. unit usage and conflict analysis.
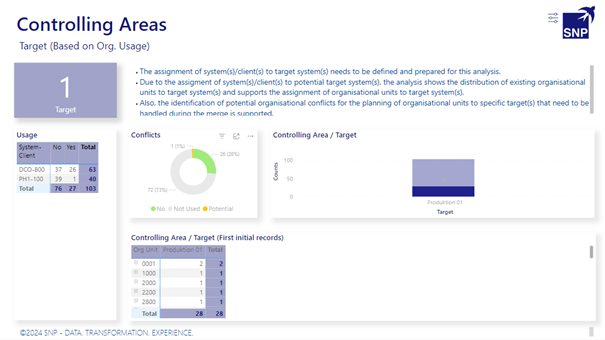
The donut chart provides the following filter options:
-
No conflicts: Shows used org. units across systems that could be merged into a target system 1:1 because they are not conflicting and will not cause any issues during the migration.
-
Yes: Shows how many used org. units exist in multiple systems with the same org. ID. These conflicts need to be resolved before the merge.
-
Potential: Shows how many org. units exist in multiple systems with the same org. ID, but are only used in one of the systems.
-
Not Used: Provides a summary of all unused organizations that could be neglected for the merge.
The bar chart on the right-hand side shows one or more target systems that would contain all organizations. The view is adjusted based on the selected filter option in the donut chart. If multiple target systems are identified, the bar chart shows the distribution of organizations into the target system(s) and highlights conflicting organizations.
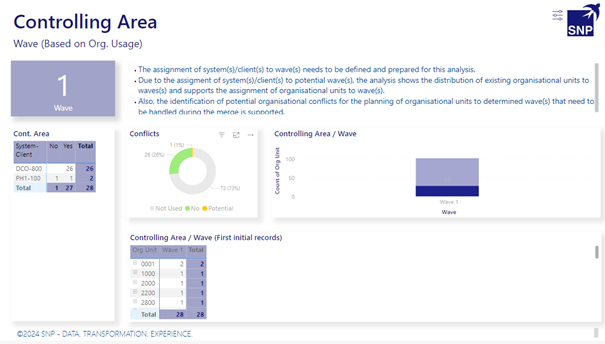
Like the previous page, the definition of waves for a merge project can be very challenging but is a requirement when merging and migrating highly complex systems with many organizations into one or multiple target system(s). To prepare a wave-based migration of company codes from multiple systems into one or multiple waves, we recommend reviewing the outcome of the report Company Locations by Region or Company Locations by Area. You can use these findings to identify how the waves could be intersected effectively. For example, you could group all company codes that are identified in the same region or area into the same wave to bundle training measures in terms of content and geography in the event of process changes that would occur with the new system.
The outcome of the report Company Locations by Region or Company Locations by Area provides an overall insight into the distribution of all company locations across systems and supports decision-making for a wave-based approach.
Before rendering the Extended Reporting for Merge, you can determine the number of waves as well as which systems to consider for which waves. A many-to-many assignment of analyzed systems to waves is possible. After rendering the report, this page will consider the number of the determined waves and the distribution of analyzed systems into the respective waves, including an org. unit usage and conflict analysis. The explanations of filter options from the previous chapter are applicable to this chapter as well.
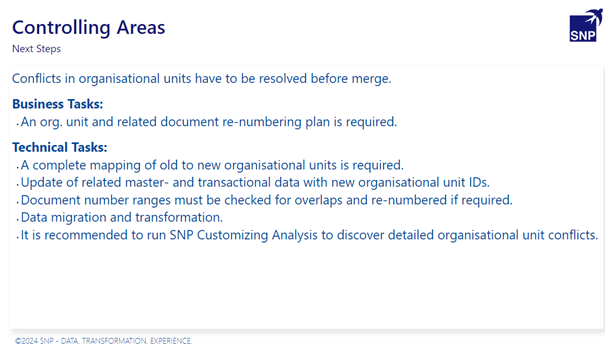
The Next Steps page gives you an overview of possible next steps that are recommended before executing the merge.