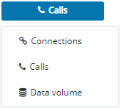
The Topology area displays the topology of your database. The connections, calls and data volume are displayed both as a diagram and as a table.
On the right-hand side, the total number of systems, connections and calls is displayed alongside the total data volume.
Functions
| Function | Description |
|---|---|
 | Displays the currently selected database. Click to select another database. The selected database is loaded automatically once you log in to CrystalBridge® again. |
| Opens database details | |
 | Changes the analysis period |
| Saves the diagram as a PNG file | |
Saves all the data as a PDF file. In addition to the data displayed as graphs and tables, the PDF file also contains an overview of the filters and selections used. | |
 | Restricts the diagram to
|
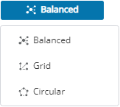
 | Changes the display of the diagram to
|
Diagram
The diagram shows all existing systems as nodes. SAP® systems are highlighted in blue.
Marked systems are indicated by a tick.
The size of the nodes and connection arrows depends on the number of connections.
Diagrams with more than 200 nodes are not generated automatically. You must confirm this in advance.
Click a diagram element to restrict the table below to inbound and outbound connections of specific systems. Right-click different elements and click Select to select multiple elements.
If you select a diagram element, the corresponding data in the areas Overview and Connections is also selected. Go to one of the areas to view the data.
Right-click an element and click Focus to focus on that element. The filter is adjusted. You can view and edit this selection in the quick filter in the ![]() EXTENDED FILTERS area. The diagram and the table are adjusted according to the filter. You can remove the focus on the element by right-clicking it again. The selection itself remains unchanged.
EXTENDED FILTERS area. The diagram and the table are adjusted according to the filter. You can remove the focus on the element by right-clicking it again. The selection itself remains unchanged.
Right-click the empty area next to the diagram and click Select all clusters. All available clusters are selected in the diagram. The table now only displays the data records of the selected clusters.
Table
By default, page 1 contains the first 25 entries that correspond to the applied filters. If there are more rows than are displayed, you can browse the other results in the table. Adjust the page size as required.
You can use the Search field to find any values in the table. You can also set a filter on each column. The amount of values that you can select depends on the filters that you have already set. The number of active selections is displayed below the search field.
You can use the text search fields below the column headers to filter for specific values in a column. You can also use wildcards. Click Add selections to filter to include your selections in the filter.
You can click ![]() Export to Excel to export selection criteria and statistics as Excel files. The content of the file depends on the filters you have applied to the table and the columns you have selected.
Export to Excel to export selection criteria and statistics as Excel files. The content of the file depends on the filters you have applied to the table and the columns you have selected.
Click the Choose columns drop-down menu to select the columns you want to display in the table.